IBEC Full Story
The Future of Health & Safety Analytics
Being highlighted by IBEC is a huge endorsement – not just of our technology, but of our mission:
to make compliance simpler, safer, and smarter for every organisation.
Read the Full Story on the IBEC Website, published in their Engage Journal.
Our expert insights on health and safety technology were published by IBEC, Ireland’s largest and most influential business representative organisation.
The article, titled “The Future of Health & Safety Analytics”, explores
Moving from reactive reporting To real-time, predictive, and actionable safety intelligence
Traditional health and safety reporting often relied on monthly or quarterly summaries by the time leadership saw the data, the opportunity to act had already passed.
Today, that model is no longer enough.
Modern platforms — including iProtectU — are enabling organisations to:
- Capture data in real time
- Visualise trends instantly
- Act before incidents occur
This is where safety becomes proactive, not reactive.
Below, we share the central guidance from the IBEC publication – along with our own context on why these principles matter.
Full IBEC Story (Reprinted)
Every organisation collects data, but not every organisation uses it effectively. In health and safety, information is often scattered across spreadsheets, paper forms, and legacy systems. The result is a mountain of numbers that describe what has happened, but not why, or what to do next.
Modern analytics are changing this. By combining smart data collection, integration, and visualisation, organisations can move from hindsight to insight, and ultimately to foresight. The future of safety lies not just in gathering information, but in turning it into meaningful, preventative action.
From Data Collection to Intelligence
For many years, safety data has focused on lagging indicators such as lost-time incidents or accident frequency. While essential for regulatory reporting, these figures describe past outcomes, not current risks.
The next generation of analytics focuses on leading indicators, measurable activities that predict performance. Examples include inspection completion rates, near-miss reports, overdue actions, and training participation.
When these inputs are tracked and analysed together, they create a dynamic picture of organisational health. Managers can see where engagement is strong, where follow-up is slow, and where interventions will have the most impact.
Integration: The Key to Meaningful Insight
Data in isolation has limited value. True insight comes from integration, linking safety information to wider business systems such as HR, maintenance, and operations, often like iProtectU in the same platform.
When a safety platform integrates across departments, correlations become visible:
- Are certain sites or shifts experiencing higher incidents due to staffing levels?
- Does training completion correlate with reduced near-misses?
- Are maintenance delays linked to equipment failures?
These insights turn reactive reports into strategic intelligence. Integration also eliminates duplication and ensures that decisions are based on one source of truth.
Visualisation: Making Data Accessible
Its commonly known that the human brain processes visuals far faster than text. That’s why dashboards and visual analytics have become essential to safety management.
Modern platforms use interactive charts, heat maps, and trend lines to translate complex data into clear stories. Instead of static reports, users can drill down by location, department, or time period to explore the underlying causes of performance changes.
When data is presented visually and in real time, it becomes actionable. Teams can prioritise, escalate, and close the loop quickly, preventing small issues from becoming major incidents.
Predictive Analytics and AI
The next evolution in safety analytics is predictive modelling. Using historical data, artificial intelligence (AI) can identify patterns that precede incidents, such as increased overtime, unclosed actions, or seasonal spikes in certain activities.
These predictive insights allow organisations to anticipate risks before they manifest. For example, an AI-driven or customisable insights dashboard can highlight that sites with low inspection frequency and high fatigue indicators are twice as likely to report near-misses in the next quarter.
This doesn’t replace human judgment, it enhances it. Predictive analytics help managers focus on prevention, not just compliance.
The Role of Real-Time Data
Traditional safety reporting often involves monthly summaries or quarterly reviews. By the time results reach decision-makers, the opportunity to act has passed.
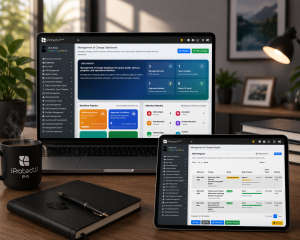
Real-time data changes that. With cloud-based systems, every action, from a hazard report to a training record, updates instantly across the organisation. Executive oversight dashboards, module based reporting and customisable insights dashboards are examples of this within the iProtectU platform.
Supervisors can monitor completion rates live; executives can view company-wide risk trends from a single dashboard. This immediacy creates accountability and enables faster, evidence-based decisions.
Data Quality: The Foundation of Analytics
Analytics are only as good as the data behind them. Inconsistent or incomplete information undermines confidence and can lead to poor decisions.
Building a culture of data quality requires simplicity, training, and trust. Systems should make it easy for users to submit accurate data without duplication or confusion.
Validation checks, mandatory fields, and automated workflows reduce errors. Equally important is the “why”, explaining to employees how their input supports prevention, not punishment. When people see data being used constructively, participation improves.
Measuring What Matters
More data isn’t always better. The challenge for many organisations is knowing which metrics actually drive improvement.
A useful approach is to balance lagging and leading indicators, combining outcome-based measures (injuries, lost time) with activity-based ones (training, inspections, actions).
Some organisations also adopt composite indicators such as “safety engagement score” or “action closure rate,” which combine multiple data points into an easy-to-understand metric.
The goal isn’t to measure everything, it’s to measure what matters and link those measures directly to performance outcomes. Only possible with customisable dashboards and real-time analytics.
Building Analytical Capability
Analytics aren’t just for data scientists. Safety professionals increasingly need basic analytical skills, from interpreting trends to building dashboards and understanding statistical variance.
Modern tools are designed with accessibility in mind, using drag-and-drop analytics, automated visualisations, and intuitive dashboards. Training safety teams to use these tools effectively is a key part of digital maturity and is a joint SaaS provider and client training responsibility.
The most successful organisations blend technical capability with human context: understanding both what the numbers say and what they mean for people on the ground.
The Ethical Use of Data
As analytics become more sophisticated, ethical considerations also arise. Safety data often includes personal or sensitive information, and organisations must ensure that privacy and fairness are maintained. Anonymised data and GDPR are therefore an important consideration.
Anonymising data where appropriate, gaining informed consent, and focusing on improvement rather than surveillance are essential principles.
Used responsibly, analytics build trust. Used carelessly, they can undermine the very culture they aim to improve.
Looking Ahead
The future of health and safety analytics is bright, and rapidly evolving. Cloud computing, AI and the Internet of Things (IoT) are transforming how organisations identify and manage risk. Wearable devices, connected sensors and smart assets are already providing real-time exposure data, from noise and air quality to worker fatigue.
The challenge is not gathering data, but using it intelligently. Success depends on clear objectives, good design and a culture that values learning over blame.
In Summary
Analytics are the bridge between compliance and continuous improvement. They turn information into action, reveal hidden risks, and help organisations make informed decisions that protect people and performance alike.
The future belongs to those who can interpret and act on their data, not just record it. With the right tools and culture in place, analytics become more than a management function; they become a driver of safer, smarter, and more resilient workplaces.
Build a Sustainable Safety Culture
Take Control of Your Compliance
With iProtectU EHS Software empower your organisation to move from reactive compliance to proactive, continuous control. Discover how iProtectU helps organisations improve compliance, reduce risk and streamline safety management.
Ready to see it in action?
Book your demo with iProtectU today and transform your GRC Software | QHSE Software | EHS Software process.